6. Operational scenarios
This section describes several operational scenarios that illustrate the role of DIMS, its interaction with users, its interface to other systems, and the states or modes identified for the system. These scenarios include events, actions, stimuli, information, interactions, etc., as applicable that form the basis for the requirements and user stories in DIMS System Requirements v 2.9.0.
A common scenario occurring regularly today involves responding to what are known commonly as botnets, or distributed intruder attack networks constructed of computers infected with malicious software (or malware). A botnet is the name given to a set of stolen computer assets that form a distributed computer attack network capable of performing many functions for a computer criminal. These functions can include any/all of the following: Distributed Denial of Service (DDoS) attacks of various types; scanning for vulnerable hosts to infect to grow the botnet; searching computers for sensitive information (e.g., email addresses, credit card or banking information, login accounts and passwords, files containing proprietary data that are to be exfiltrated; sending spam emails; etc. This is typically accomplished by first compromising a number of computers using one of several direct or indirect methods of propagation, resulting in installation of malicious software followed by outbound (or inbound) connections to achieve command and control (C&C) of the infected hosts, or bots.
The role of SIEM in this context is to provide correlation of multiple events, not just to trigger alerts based on single detected events. The Botnets system used within the PRISEM project produces reports that summarize individual discrete events, which by themselves may be false-positives. Even when a score is high because of multiple alerts being generated for repeated activity, the alert may be meaningless. Or someone may have entered an indicator into the database with low confidence of suspicious activity, which made its way into a watchlist detector that begins to trigger events when connections are seen to the watchlisted IP address. Requiring that multiple different alerts occur simultaneously (e.g., scanning, attempted SMTP connections, and suspected botnet command and control) before the events become elevated to alerts has the effect of increasing the probability that the host involved is truly compromised (i.e., a true-positive alert). The analyst looking at alerts and reports must be careful to know what the alert means, how it was derived, what its confidence level is, and whether it is a valid alert or not before passing it along, or to at least reflect a low confidence or otherwise include a caveat statement unless and until other correlating data substantiates malicious activity.
6.1. Generalized Analysis Scenario
Using PRISEM components to walk through some of the steps in responding to a suspected botnet related event helps illustrate the process:
The analyst may start with a message that provides indicators of compromise. Figure Email with indicator of SSH scanning activity shows a message reporting a suspected network involved in known SSH dictionary scanning, attempting to gain access to insecure accounts.
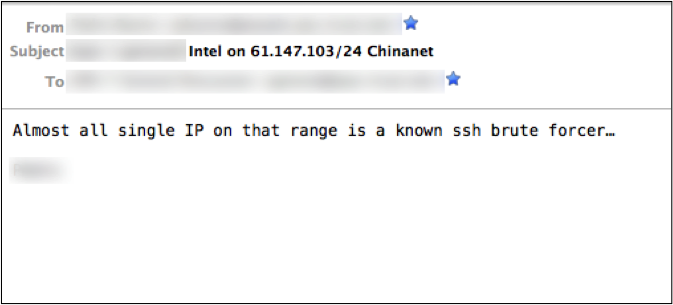
Email with indicator of SSH scanning activity
The analyst can look in CIF to find what is known about this netblock. From public sources, this network block has been known for a while to be involved in SSH password-guessing attempts. (Figure CIF lookup results for scanning CIDR block only shows the first few fields from the CIF database.)
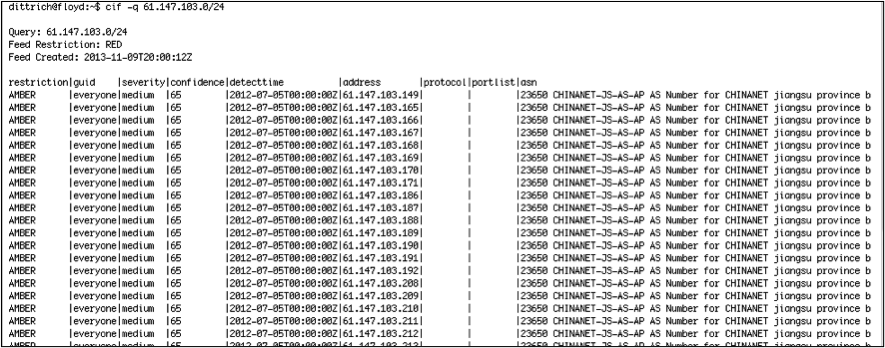
CIF lookup results for scanning CIDR block
The analyst can search historic network flow records to see if there were any recent flows to/from the reported suspect CIDR block. In this case, a seven-day search does turn up some flows. The output in Figure Confirmation of network flows related to suspect CIDR block shows both raw output form and anonymized output using the methods described earlier:
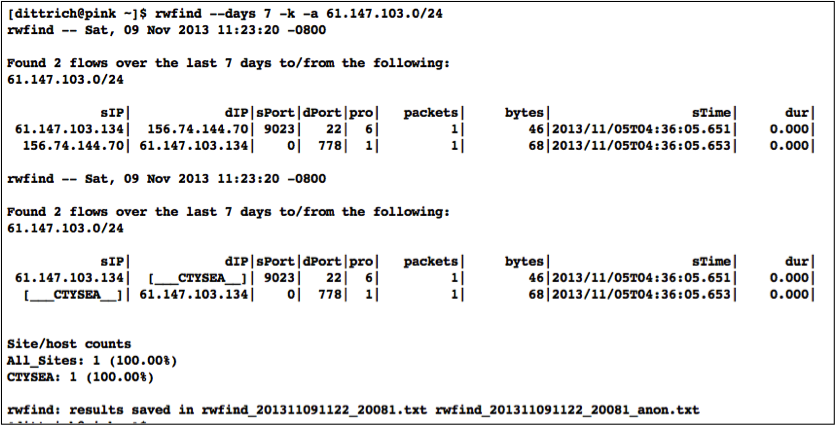
Confirmation of network flows related to suspect CIDR block
The analyst may then query CIF using the web browser interface to see if this specific IP address, seen in the identified flows from the previous step, has any information about it. Figure Output of full CIF query via browser plugin confirms that it does (including showing a record of the search for the suspicious CIDR block from a previous step).
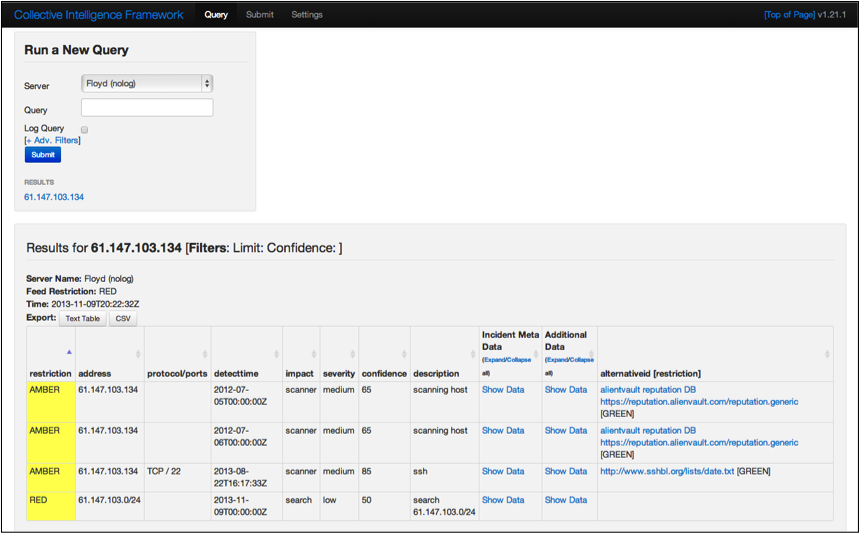
Output of full CIF query via browser plugin
The analyst can then search for the same information, this time using a dashboard portal. Using the dashboard user interface, a search is initiated for the IP address found in the network flow report.
The search results can be saved to a comma-separated value (CSV) file for further manual processing.
PRISEM portal CSV output
At the end of these steps, the analyst knows more about whether any PRISEM participants had any interaction with these suspect hosts, but these interim results are not integrated into a single report, the contextual knowledge embodied in one part of the system is not carried over into output of another part, and there is no qualification of the events that were identified. Were these scanning attempts blocked (meaning low relevance for response) or were there actual flows that would lead to a conclusion of compromise of any assets (meaning high relevance for response)?
If the steps in the workflow process are too numerous, too manually intensive, and too cumbersome, an analyst is slowed down and rendered less effective or limited in their ability to adequately respond. They may waste time, or may not complete the task, allowing attackers to slip past. If the user must log in to a portal and initiate the process by cutting/pasting individual IP addresses, and pointing/clicking on a Run! button, the process will only happen when the human is there to initiate it. Automating these tedious and repetitive tasks, and scheduling some common tasks to be run automatically so the results are waiting to be viewed, frees up the analyst to focus on the hard problems that require human intelligence. This is the only way to increase the velocity of the defender closer to that of the attacker as described by Col. John Boyd in his OODA Loop – Observe, Orient, Decide, and Act – construct. [Boy08], [Ric09]
6.2. Mission Operations Scenarios
In the following subsections, we will look at some common workflow processes involving IOCs in an operational context. There are three primary use cases of workflows that the DIMS system must serve include the processing of IOCs:
- Sent into the system in a semi-automated manner;
- Entered manually in response to external activities (e.g., collaboration in closed, vetted, trust communities, from information passed along from law enforcement, etc.), and;
- As discovered in the iterative and recursive steps taken by an analyst as part of the network forensic process. These use cases parallel the MITRE STIX uses cases UC1, UC3, and UC4 described in Section Description of needed changes. Each of these use cases will be described as a separate Mission Operations Scenario.
6.2.1. Automated IOC sharing
Automated sharing of IOCs is not as simple as someone sending an IOC file, which is implicitly acted upon as if it were a request to go search events for some previous period of time and immediately return a report. A human being must validate the results for accuracy and adherence to information sharing policies, approve of the result, and manually release the file to outside parties (possibly after redacting some of the information in the report). This means that even if the first task of performing a historic search is fully automatic, there must be a mechanism for alerting someone that the report is ready for review, multiple automated and asynchronous query results must be queued until they have all been processed, and specific reports must be chosen, analyzed, and released at the appropriate time to the appropriate parties.
There are actually two sub-use cases for automated IOC sharing (one an external-to-internal sharing followed by a reciprocal return internal-to-external sharing, and the other an internal-to-external sharing). Both have privacy sensitivities that require anonymization and controlled release of information.
The first is the situation where US-CERT will be sending de-classified IOCs to the PRISEM system in the form of STIX files, [The12] to determine if known malicious activity seen at the federal level is also being seen at the SLTT government level. This is automated input and manual (i.e., vetted and approved) output going back up to the federal level. (Other organizations, such as Microsoft’s MAPP program, are similarly being established to share IOCs using STIX, [Blu13a], [Blu13b] so STIX packages will become a general input mechanism. An example [abbreviated] STIX file that holds IP addresses and CIDR blocks extracted from a CIF database for use as a watchlist is shown in Figure Example watchlist in STIX format.)
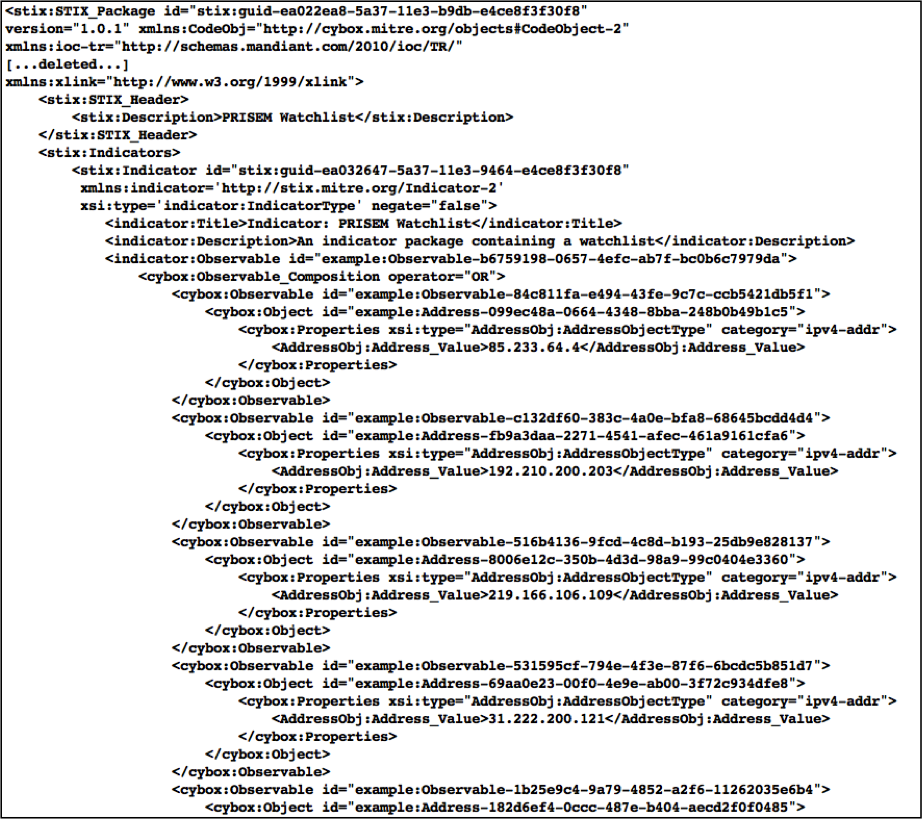
Example watchlist in STIX format
The second is automated determination of the sources of confirmed malicious activity seen at the SLTT level that are collected on a daily basis and prepared for sharing with federal law enforcement and counter-intelligence agents to determine if known cases being investigated by federal agencies involve parties locally. The targets of the attacks (i.e., the sources of the IOCs within the PRISEM participant base) are not shared, but only data about the outside malicious sources. If federal agents determine that there is a match with an open investigation, they will discretely reach out to a designated contact within the PRISEM system who can assist in reaching out to establish connections with the source (should they chose to make such a connection.) In the future, mechanisms that support privacy-perserving set intersection operations based on homomorphic encryption algorithms have proven useful in comparing data sets containing sensitive information without exposing that information to either of the parties involved in the comparison. [dCT10] .. _manualentryofiocs:
6.2.2. Manual entry of IOCs
The second case is similar to the external-to-internal sharing use case just described. An analyst or research affiliated with the PRISEM project who may be part of a closed, vetted, trust community, may come to possess information about known or suspected malicious activity derived from investigations performed by another member of said community. That information may be highly sensitive, but also may be highly indicative of targeted activity that has previously escaped the view of the information security vendor and researcher communities, which means it may have bypassed any and all detective mechanisms and never triggered an alert within PRISEM’s SIEM system (i.e., it is a false negative). The analyst would enter data, perhaps in the same way as with the US-CERT IOCs, but processed separately and not queued for potential release to US-CERT. If this check determines there is no evidence of activity within the PRISEM data pool, the analyst is notified. The analyst may optionally chose to enter these indicators into a watchlist to alert if/when those indicators are seen in the future (with a note as to why they were put there in the first place, what the suspected activity involved, etc.) This contextual data is best kept in CIF, where it can be correlated with other activity reported by the community in the future. If, on the other hand, there is confirmation that PRISEM participants have been involved in the same activity, the analyst has just performed the first iteration of the next use-case we will consider.
6.2.3. Network Forensic Analysis
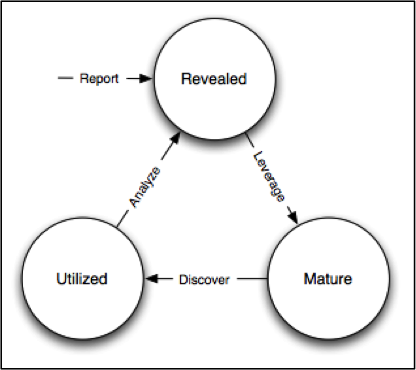
Indicator Lifecycle
The final use case is the most complex, as it involves a series of iterative and recursive queries of available data, going back and forth through time, and extending outward from an initial point to build a network of known hosts involved in various phases (see Figure Indicator Lifecycle) of what is known as the cyber kill chain. [HCA11]
The steps described in Section Generalized Analysis Scenario and the previous two workflows are repeated, following the process shown in Indicator Lifecycle. The discovery and analytic process can refine the understanding of when response actions must be taken, however the deeper an analyst goes using this cycle, the larger the number of discrete files are created in the form of intermediary results and simple output reports. The task of the analyst gets harder and harder to perform as they are buried in related, but unlinked, raw data. This makes it crucial that machine-parseable data be used as both input and output for the steps within each workflow, using a pipeline methodology to take the results of one process and use it in the next step of the process, as well as to attenuate the volume of raw data by applying selective filters to reduce the noise. This is not possible with primitive forms-based browser interfaces that are not designed to maintain and use state (e.g., knowledge gained by the analyst in previous steps) between invocations.
6.3. Mission Support Scenarios
We will now look at some other general Mission Support Scenarios that focus on improving the efficiency of daily communications workflow processes.
6.3.1. Tracking Status of Remediation Efforts
A regular occurrence within the Ops-Trust community is someone reporting a large number of hosts or network autonomous system (AS) numbers that have vulnerable, exploited, or infected computers. The Subject line usually reflects something about the data (e.g., 1.2M NTP amplifiers identified) Members of the list will read these email messages, extract the list from the body of the message or attached files, process the list (often with a custom script), and do what they can to mitigate the threat within their own network. Some will respond to the email with something like “ACK for AS123, AS456, and AS789”.
While these acknowledgement messages are nice, nobody is responsible for
tracking them, updating a list with status, etc. It is impossible for one to
know, without themselves tracking the entire thread and accumulating the
results from all responses, what percentage of the original list of 1.2M items
has been mitigated, which ones are left, etc. Such lists are sometimes sent in
the body of the message in what is known as a Cymrufied list (columns of IP
addresses, AS numbers, etc, separated by vertical bar | characters, made
popular by Team Cymru. (See Figure Example “Cymrufied list”). Sometimes they are
Excel spreadsheets attached to the message, or Comma Separated Value (CSV)
files. Sometimes people just put a CIDR block in the Subject line of a message.
The method is ad-hoc, random, and often requires writing custom scripts to
process and extract just the data relevant to one’s own network. It is not
uncommon to receive a Cymrufied list that is placed in a GZIP compressed
Unix/Linux tar archive file, which is then attached to an email message
(necessitating extraction, unpacking the archive, processing the included file
with a script, then deleting the .tar.gz file, all manually.)
Example “Cymrufied list”
The DIMS system will automate this process by supporting the automatic recognition and processing of structured data files either uploaded into the system, attached to email messages, or sent over TAXII or an AMQP message bus. These structured files can then be processed and the context used to track activity (i.e., is this the initial report, an acknowledgement that certain items have been mitigated, etc.) This also allows tracking of the status of mitigation, statistics over time, etc.
6.3.2. Situational Awareness Through “Identifying Friend or Foe”
When trying to analyze events and alerts in a haystack of data, one method of extracting meaning from the data is to organize it according to facts that are known about the entities that are identified in the haystack of data. A first order of meaning can be derived from taking the end points of connections and categorizing them according to which sets they belong to: known to be a PRISEM participant (a.k.a., friend), or known to not be a PRISEM participant.
| CIDR or Domain | Site ID | Participant |
|---|---|---|
| 156.74.0.0/16 | CTYSEA | CTYSEA |
| .seattle.gov | CTYSEA | CTYSEA |
| .seattle.wa.gov | CTYSEA | CTYSEA |
| .seattle.wa.us | CTYSEA | CTYSEA |
| 192.103.189.0/24 | PORTTAC | PORTTAC |
| 66.113.101.0/24 | PORTTAC | PORTTAC |
| .portoftacoma.com | PORTTAC | PORTTAC |
| 174.127.160.0/24 | COB | BELLWA |
| 12.17.152.0/23 | COB | BELLWA |
| .bellevue.gov | COB | BELLWA |
| .ci.bellevue.wa.us | COB | BELLWA |
Table Participant identification mapping illustrates how organizational top-level domains and/or CIDR blocks for a subset of PRISEM participants are mapped to their Site ID strings and chosen anonymization strings (i.e., the label that participant would like to use to mask their internal IP addresses and host names in reports that are shared outside the trust group.) When events are logged, and those logs are ingested into the PRISEM system, they are processed so as to associate them with the site from which they came. Once in the historic log archives, an analyst may search for a specific observable (e.g., show me all connections to/from a specific suspect IP address.)
Using this mapping of domains and CIDR blocks to participants, it is possible to identify all records in search results that are associated with any of the PRISEM participants, count how many discrete hosts within each participant site were found, and produce cross-organizational correlation statistics that describe the percentage breakdown of all identified records in the search results. An example of what this process produces can be seen in Figure Venn diagram of matching/not-matching sets. In this example, hosts from seven different PRISEM sites were found, with the three most frequent results being in Seattle Childrens Hospital (70.65%), Kitsap County (26.61%), and Port of Olympia (1.38%).
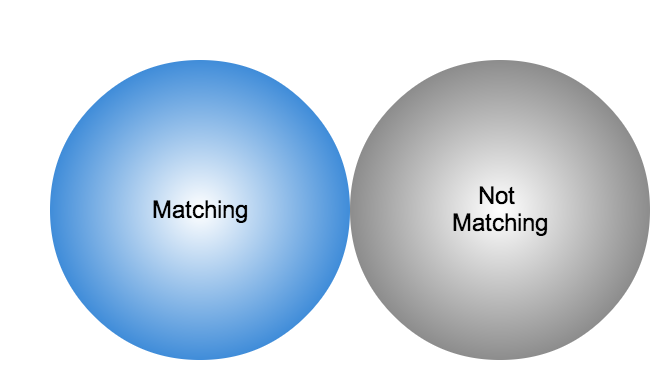
Venn diagram of matching/not-matching sets
Making only one pass over a set of data only allows us to extract IP address and domain names known to be in the map, or not in the map, deriving two non-intersecting sets of entities that are either matching and not matching. This is depicted graphically with the Venn diagram in Figure Venn diagram of matching/not-matching sets.
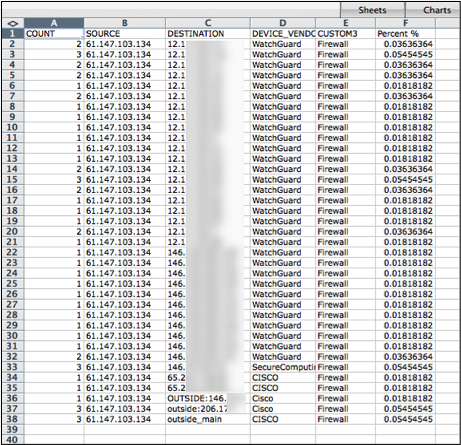
Without any other information or context about the not matching entities that were identified, there is not much that can be deduced about those entities, other than they were involved in connections associated with whatever the analyst was searching for. We can define the results of this pass as identifying friend (because we are using a mapping of what constitutes friend sites). This is, in fact, how the output of the Cross Correlation service is tagged in Figure Cross-organizational Correlation of Query Results (Redacted).
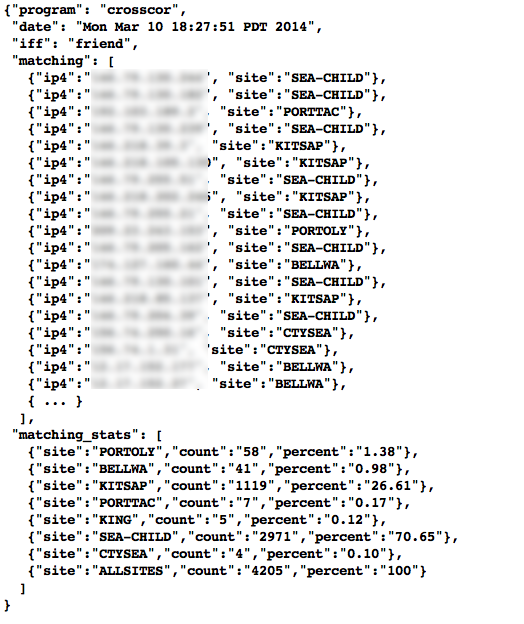
Cross-organizational Correlation of Query Results (Redacted)
Now that we have the list of entities that are not our friends, we can make a second pass and add context that will be useful in helping make decisions. Rather than just known and not known, we can determine, based on information provided by selected authorities to have a certain level of probability of being involved in malicious behavior, that an end point of communication is believed to be hostile (a.k.a., foe). The Collective Intelligence Framework accumulates reputation data from sources that the security community deems to be trustworthy in determining which are malicious. If an IP address or domain name occurs in a CIF feed of 65% confidence, then we can assume with 65% confidence that any connections from a PRISEM participant are highly suspicious indicators of malicious activity. If that IP address is not known to any sources that feed CIF, it may or may not be malicious. It could be associated with an advanced persistent threat actor who performs targeted attacks and evades the security industry’s sandboxes. Or it could be a totally innocent new social network site related to an animal rescue organization. The context and search criteria used by the analyst to get the data being processed holds some clues as to whether the connections are innocent or malicious, and adding context regarding reputation from the security industry and researchers assists even more in making a determination of innocent or malicious activity.
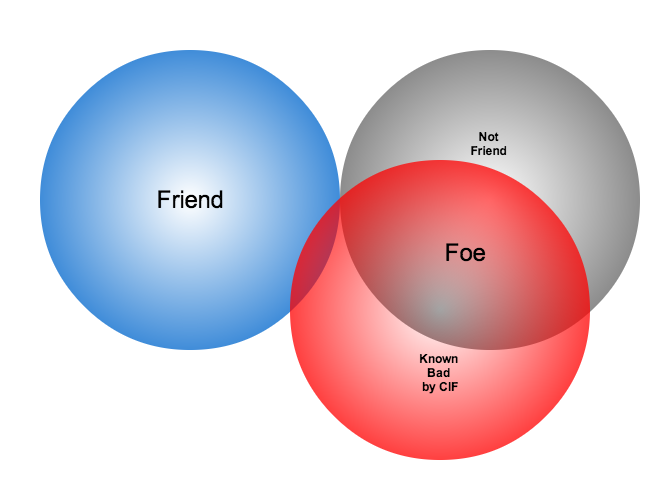
Identifying Friend or Foe Based on Reputation Data
Figure Identifying Friend or Foe Based on Reputation Data illustrates how this second pass works. Starting by identifying those entities that match a mapping of Friend, the set of Not Friend can then be compared with the set of known malicious entities stored in CIF. Those that are in the intersection of Not Friend and Known to be Bad by virtue of being found in the CIF database are labeled Foe, and the remainder are just Unknown at this point. (As an analyst confirms they are actually Foe, they should be entered into CIF to allow a positive identification of Foe in future queries. This is part of the intelligence gathering process.)
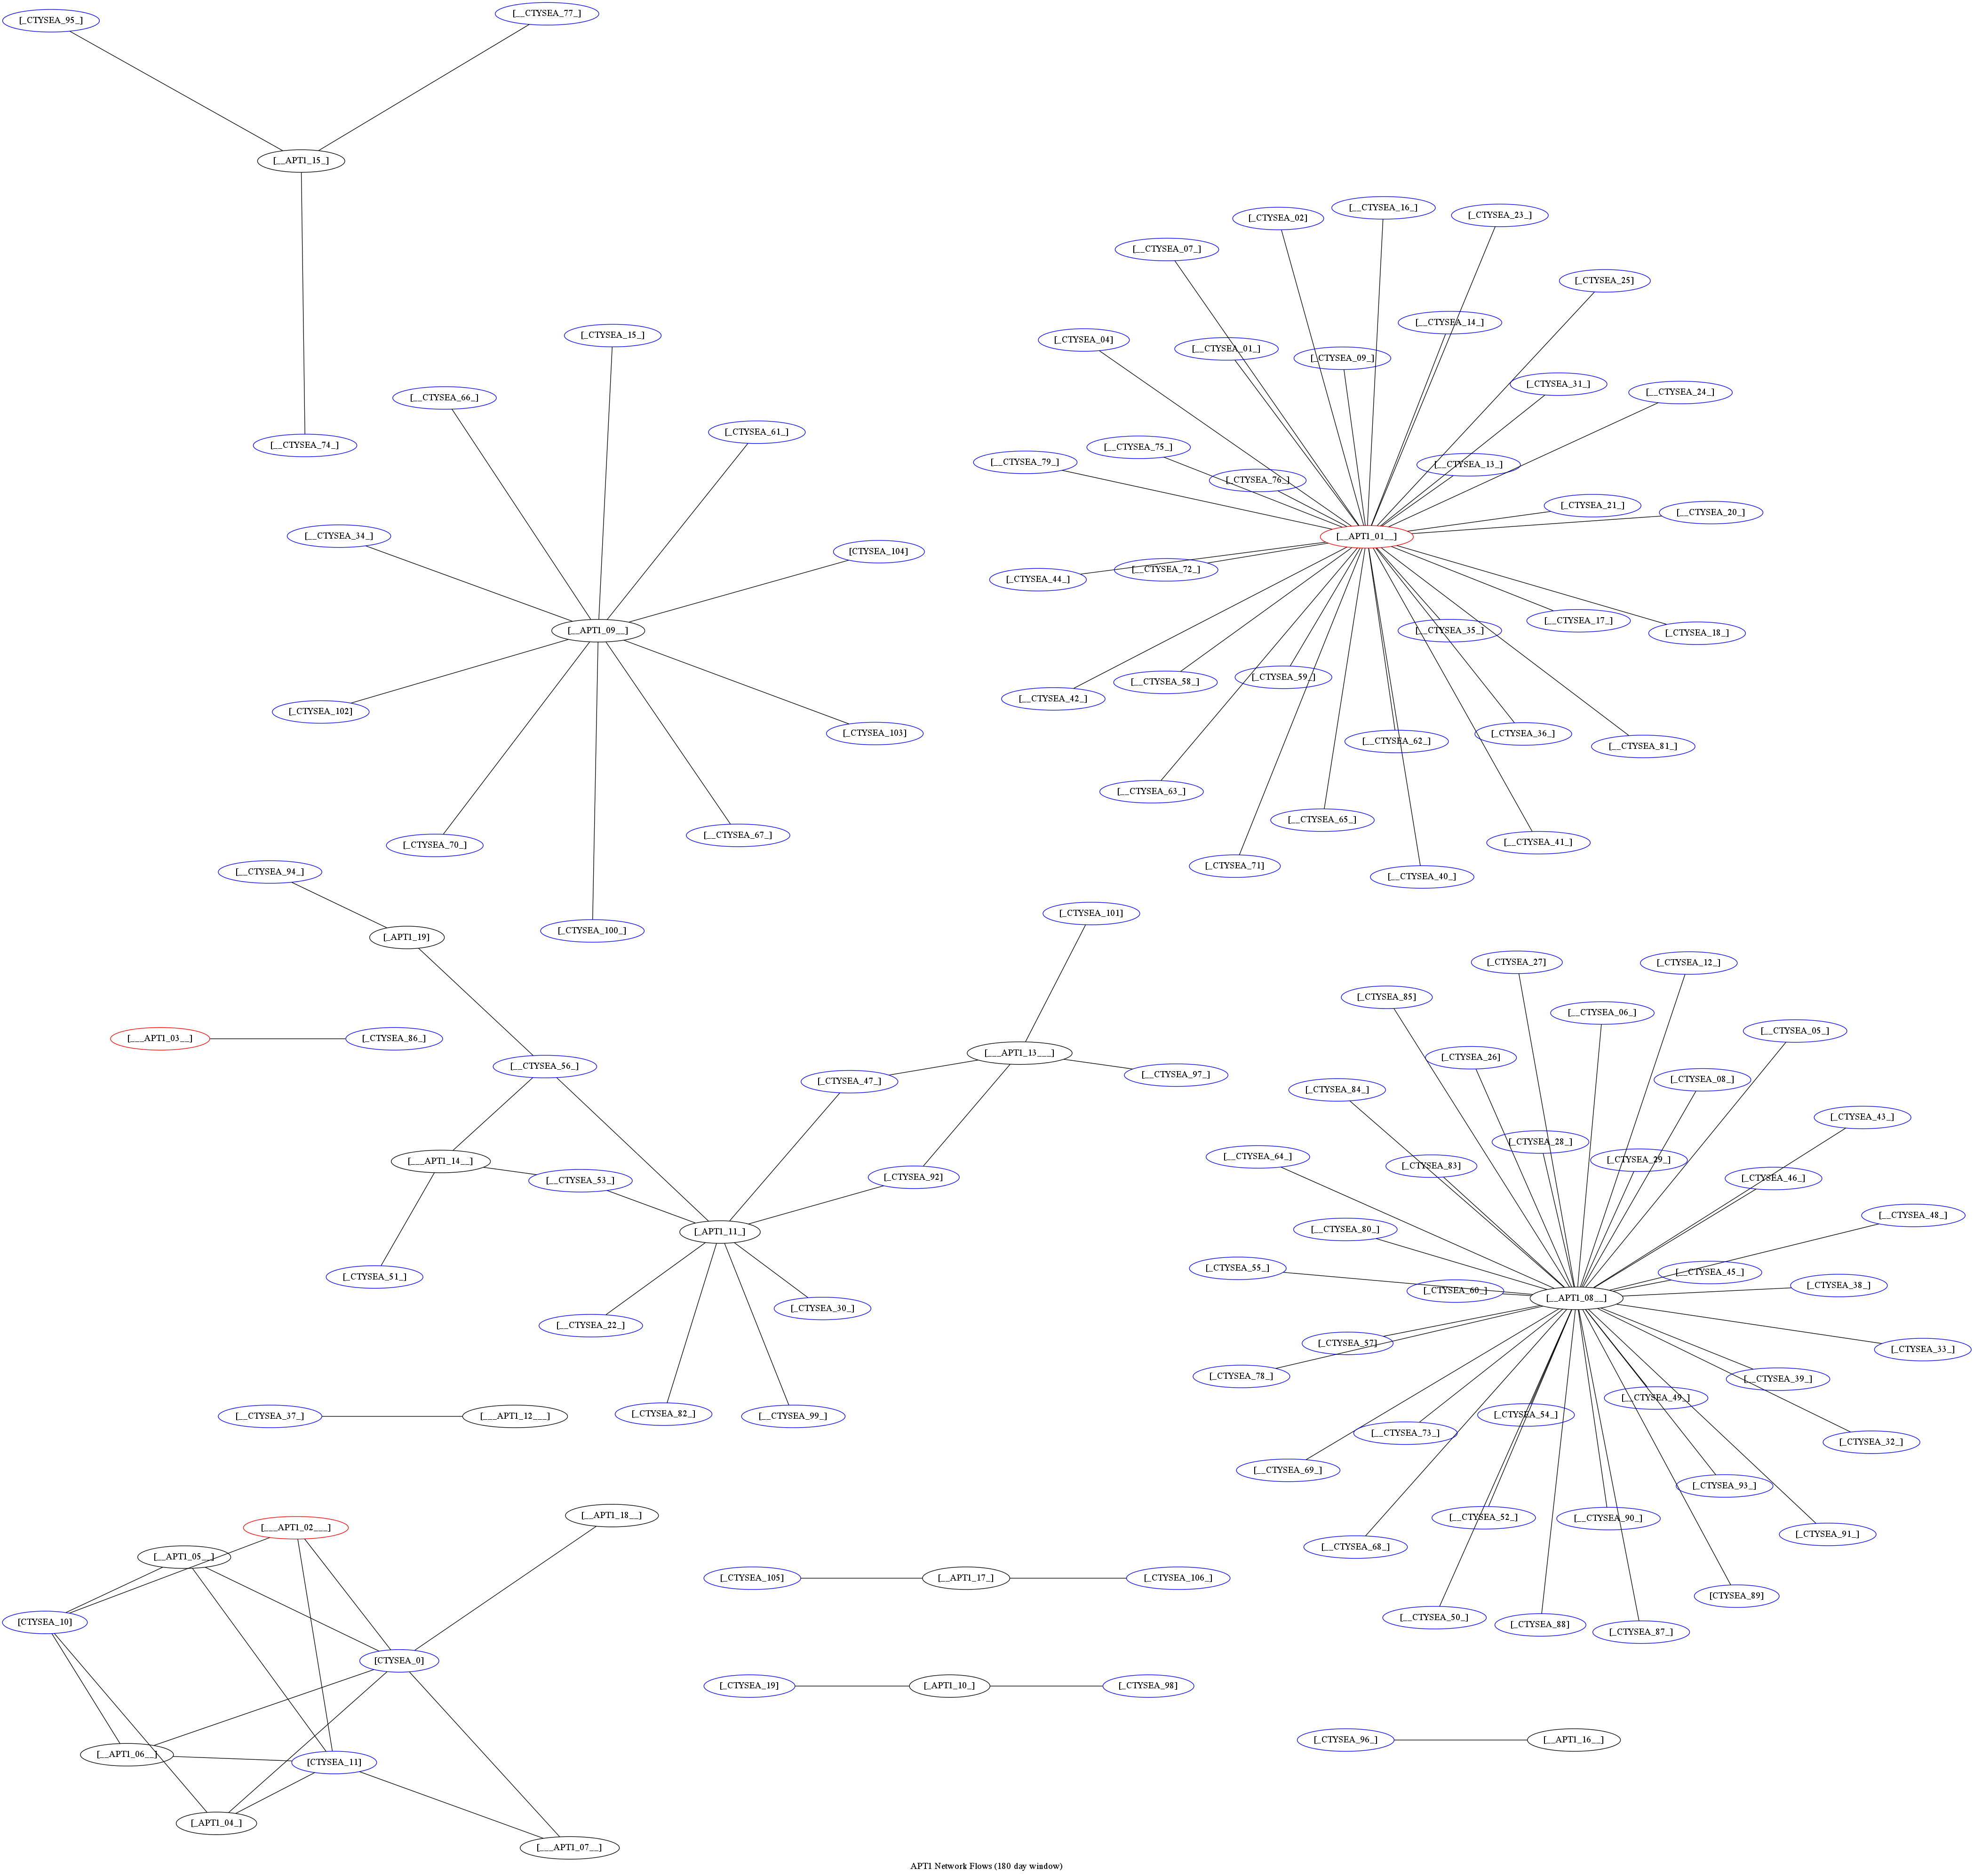
Graph of all APT1 Related Connections (180 Day Window)
The results of applying the outcome of identifying Friend and Foe to network flows can be seen in Figure Graph of all APT1 Related Connections (180 Day Window) (close-up views of this large graph are found in subsequent figures) These are undirected graphs of connections associated with the set of IOCs released by the FBI in Joint Indicator Bulletin (JIB) #INC260425 in the wake of the release by Mandiant of their APT1 report. [Man13] Of the 632 IP addresses in the JIB list, it was possible to identify over 7000 flow records associated with 106 hosts on the City of Seattle’s network over the previous 180 days. All of those flows were related to just 22 hosts out of the FBI’s list of 632. A search of event logs archived in the PRISEM SIEM identified another three SLTT entities who also had logged events corresponding with indicators on the FBI’s list. (In this section, only the City of Seattle network flows are analyzed.)
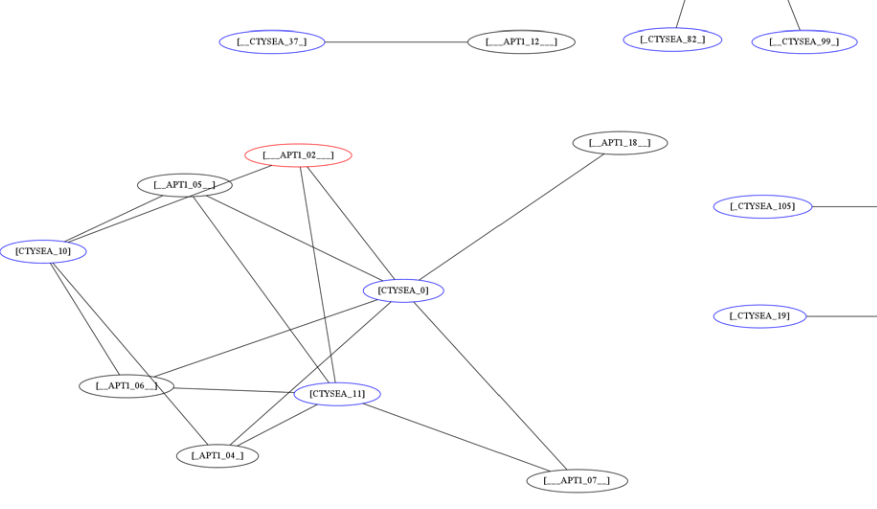
Patial Graph of APT1 Connection End Points
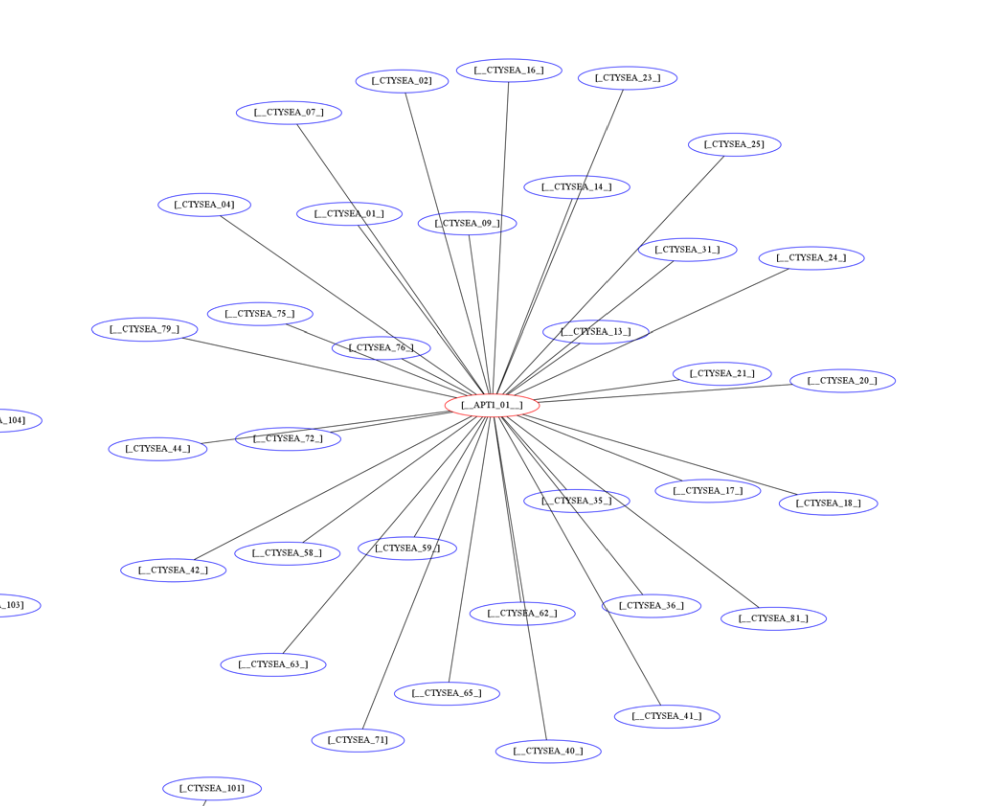
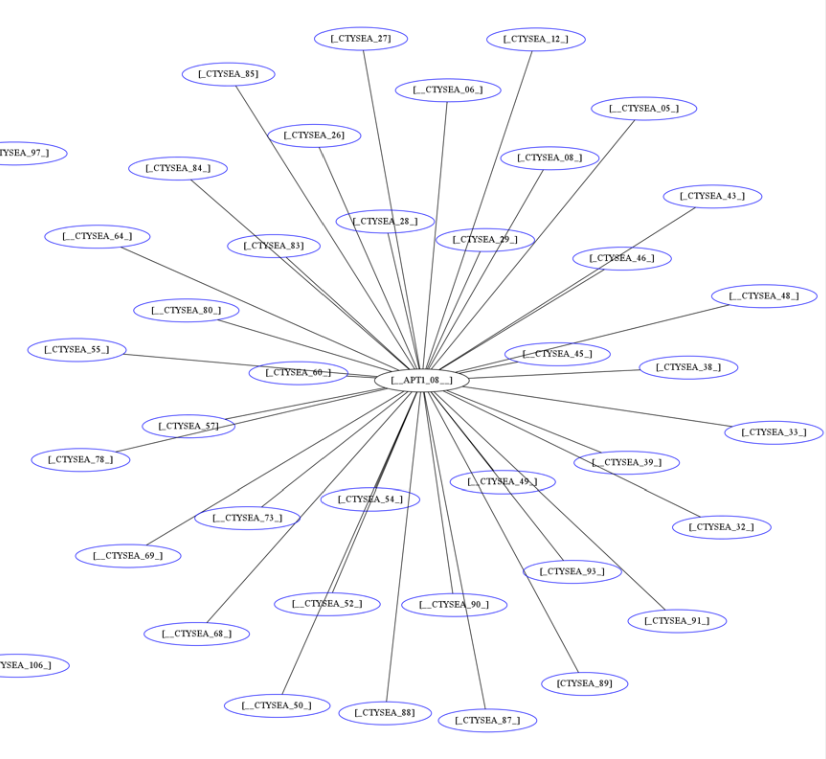
The cluster in the bottom left of Figure Patial Graph of APT1 Connection End Points shows three Friend hosts (blue nodes labeled CTYSEA_nn) in communication with six JIB-identified (APT1) hosts, only one of which was known by the security industry and made it into the CIF database used by the PRISEM project. Examination of the flows to/from these hosts shows them all to be DNS requests, which is highly indicative of Fast Flux DNS for evasion of detection during malware infection. Figure Connections to a Known Malicious Entity shows a large number of Friend hosts connecting to a known to be malicious APT1 host, while Figure Connections to an APT1 entity Unknown to CIF shows an even larger number connecting to an APT1 host that had evaded detection by the security industry and researchers. The context provided by CIF allows rapid triage of the first set, but the lack of known reputation data points to the need to dig deeper and do more thorough analysis of flows and/or perform host-level forensics on the second set of hosts to determine the severity of compromise.
Connections to a Known Malicious Entity
Connections to an APT1 entity Unknown to CIF
This same process can be applied to textual reports, which could focus on each of the discrete clusters in Figure Graph of all APT1 Related Connections (180 Day Window), including such attributes as: country of origin for non-Friend nodes; AS of origin for non-Friend nodes; Type of activity for Foe nodes as known to CIF (including first seen, last seen, etc.); Characterization of identified flows and identified log events (including ports, protocols, start time, duration, etc.).
| [Boy08] | John R. Boyd (Col.). Boyd’s OODA “Loop” From “The Essence of Winning and Losing”, 2008. Available at http://www.d-n-i.net/fcs/ppt/boyds_ooda_loop.ppt. |
| [Ric09] | Chet Richards. Briefings - Colonel John R. Boyd, USAF. http://www.ausairpower.net/APA-Boyd-Papers.html, November 2009. |
| [Blu13a] | Bluehat1. New MAPP Initiatives. http://blogs.technet.com/b/bluehat/archive/2013/07/29/new-mapp-initiatives.aspx, July 2013. BlueHat Blog. |
| [Blu13b] | Bluehat1. MAPP Initiatives Update – Knowledge Exchange Platform. http://blogs.technet.com/b/bluehat/archive/2013/09/16/mapp-initiatives-update-knowledge-exchange-platform.aspx, September 2013. BlueHat Blog. |
| [dCT10] | Emiliano De Cristofaro and Gene Tsudik. Practical private set intersection protocols with linear computational and bandwidth complexity. https://eprint.iacr.org/2009/491.pdf, 2010. |
| [HCA11] | Eric Hutchins, Michael Cloppert, and Rohan Amin. Intelligence-Driven Computer Network Defense Informed by Analysis of Adversary Campaigns and Intrusion Kill Chains. In 6th Annual International Conference on Information Warfare and Security. Lockheed Martin Corporation, http://www.lockheedmartin.com/content/dam/lockheed/data/corporate/documents/LM-White-Paper-Intel-Driven-Defense.pdf, December 2011. |
| [Man13] | Mandiant. APT1: Exposing One of China’s Cyber Espionage Units. http://intelreport.mandiant.com/Mandiant_APT1_Report.pdf, February 2013. |